

MaREI present Selkie tool at world’s largest GIS conference
Taking the geographic approach to address a techno-economic challenge in ocean energy: MaREI present Selkie tool at the world’s largest GIS conference
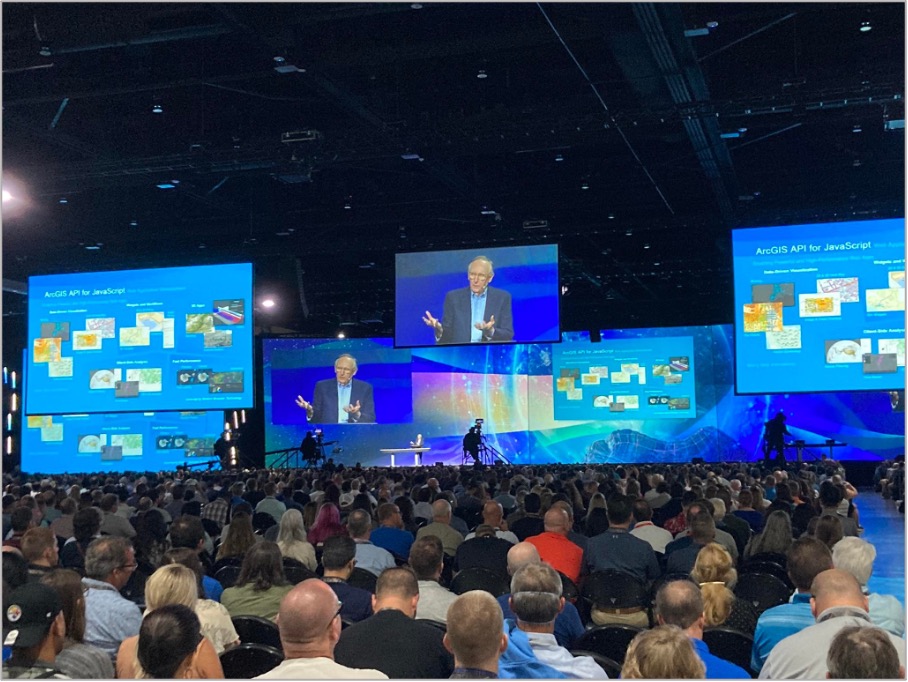
 The Esri User Conference takes place once a year and is the largest GIS conference in the world. This year saw the return of the conference to the San Diego Convention Center in California for the first time in three years due to the Covid-19 Pandemic. Approx. 30,000 people were signed up for this year’s event, with 14,000 in-person attendees and 16,000 online. On July 11th, Jack Dangermond (leader of Esri) opened the 5-day event with the plenary session in front of thousands of enthusiastic and excited GIS users from around the world. His speech outlined the importance of GIS in a global society for dealing with some of the toughest challenges we face in the here and now, such as pandemics, war and global climate change. Jack highlighted some of the Esri products that help us to do so, including the ArcGIS API for JavaScript which was used to develop the Selkie tool.
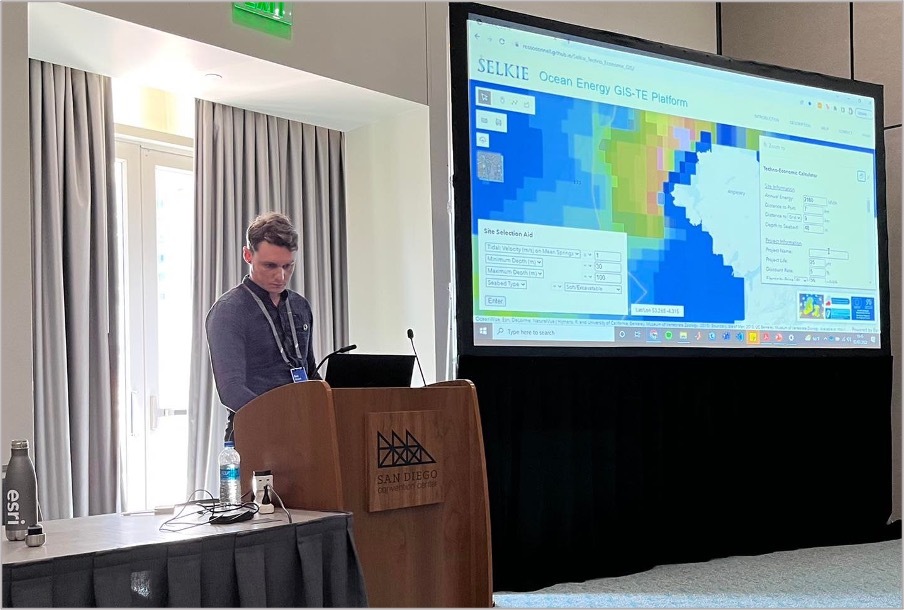
Selkie was invited to attend this year’s event to present on the development and application of WP4’s combined Geographic Information System (GIS) and Techno-Economic (TE) tool. This presentation was the focus of a session titled Projects in Bio and Hydro Renewable Energy and was attended by GIS experts in Renewable Energy. In addition to the presentation, attendees were treated to a demonstration of the GIS-TE tool in action, using the case study of a tidal energy project in the Irish Sea.
The Selkie GIS-TE Tool Overview
Accurate and up-to-date Geographic Information System (GIS) and Techno-Economic (TE) tools are pertinent to helping to develop the Offshore Renewable Energy (ORE) sector. Many existing tools of this nature are not open access; are unsuitable for ocean energy; are limited by a lack of detailed information on the technology and/or the site, and focus almost entirely either on GIS or TE aspects of analysis. To address this, WP4 of the Selkie Project at MaREI have developed the first combined GIS-TE software tool for ORE. The tool is open access; contains over 50 user-interactive layers representing the most up-to-date geospatial data for ORE project site selection; incorporates an unprecedented spatial resolution of resource data, and provides project and site-specific Key Performance Indicators (KPIs) for contemporary ORE devices.
The Geographic Approach
Not everywhere offshore is suitable for the deployment of ocean energy devices. Site selection needs to take into account a number of core criteria to sieve out unsuitable sites. These include resource availability, water depth and seabed character. Project feasibility is then measured using KPIs known as NPV and LCOE. The process of calculating these metrics is referred to as Techno-Economic (TE) analysis. TE analysis for ocean energy is relatively nascent and extremely complex. However, it is also inherently spatial in nature as it is affected by geospatially variable criteria such as the annual energy production (AEP) of the device (related to the resource), proximity to the nearest port and proximity to the nearest grid access point.
Taking a geographic approach and introducing GIS to TE analysis through the development of a combined GIS-TE tool can help users to:
- Identify suitable sites for deployment, and,
- Determine the project feasibility at those sites.
However, a ‘one size fits all’ approach is not suitable, and so user input in defining the values of these input criteria is required. The tool, therefore, needed to be user-friendly and interactive.
Use of Existing Software Tools
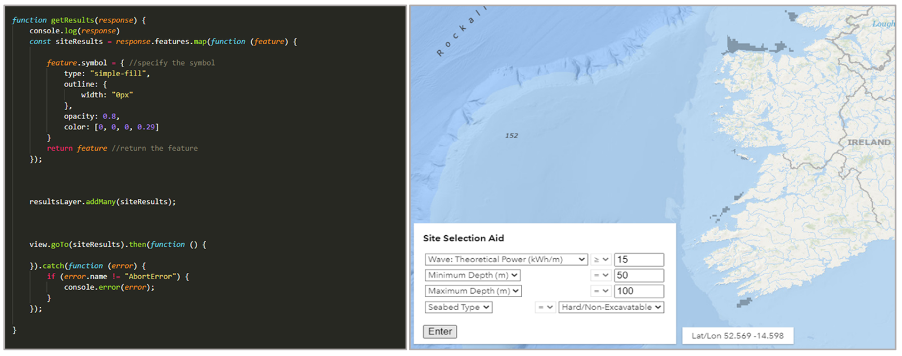
Using Esri’s ArcGIS API for JavaScript (JS), the GIS-TE tool was developed as a web-app in Visual Studio Code. The oceanographic data was downloaded in the form of netCDF files which needed to be processed in MATLAB to make it GIS compatible. The Annual Energy Production (AEP) layers were also computed in MATLAB by applying the power matrices/curves of contemporary devices to this data. ArcGIS Pro was used to pre-process all geospatial data before sharing to the cloud as web-layers in ArcGIS Online. Once stored in the cloud, each layer could be called in the JavaScript API via a URL link.
A site selection aid was developed using the JavaScript API ‘query’ class on an invisible layer which contained a field for each of the site selection criteria. Running the site selection aid would then highlight areas on the invisible layer meeting the desired site criteria.
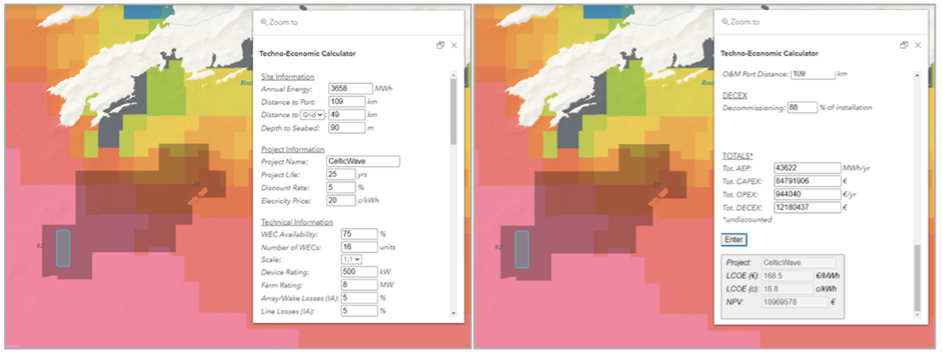
The TE calculator was designed using the JavaScript API ‘PopupTemplate’ to be activated via the layer list. The user selects either a wave or tidal energy project (soon to also include offshore wind) before choosing a device or theoretical calculation for the AEP. On clicking their desired location for deployment, the TE calculator is activated as a pop-up window in which the user can then start to perform the TE analysis. All inputs in the TE calculator have a default value. The site-specific inputs are determined by where the user has chosen their site and the technical inputs are based on the best available literature in ORE, all are user adjustable. The total AEP, Capex, Opex and Decex are summarized before the user hits ‘Enter’ to run the calculation. LCOE and NPV then appear in the results pane under the project name.
Expected Impact
When released, it is anticipated that the tool will be used by:
- ORE project developers – identifying deployment sites and calculating project feasibility at those sites
- Government – identifying areas within the Irish and U.K. EEZs which should be designated as ORE development zones (SEAI are already using some of the Selkie GIS data)
- Academia – for researchers working on ORE projects and for lecturers teaching students about ORE or marine spatial planning.
About the Author
Ross O’Connell is a PhD student at MaREI’s Beaufort Building in Cork and is currently leading WP4 of the Selkie Project. He has an MSc in Geography and Geoinformatics from the University of Copenhagen, a Higher Diploma in Geography from University College Cork, a BSc in Project Management from Munster Technological University and has taken courses in coastal and marine management at the University Centre of the Westfjords in Ísafjörður, Iceland as part of a Nordic exchange scholarship.
Networking events were arranged each evening for groups with specific GIS interests, such as energy resources, early career professionals, developers, etc. At the energy resources social, a lot of people came to me wanting to find out more about ocean energy and the work we do both at MaREI and on the Selkie project. Some of the people I met at these side events will be friends for life, and meeting people face-to-face to discuss the challenges, developments and opportunities present in the ever-growing world of GIS was terrific. Other sessions and stands I attended also helped with some aspects of the tool that I still need to address, such as licencing, metadata and some spatial analysis glitches. The organisers held a party at Balboa Park on the last night of the conference, which included live music and free access to some of San Diego’s finest museums. As I waited to board my plane the next morning at San Diego International Airport, I nearly had to pinch myself to make sure it wasn’t all a dream.
Researcher in GIS and Techno-Economic Analysis for Offshore Renewables
MaREI @ UCC